
ER diagram
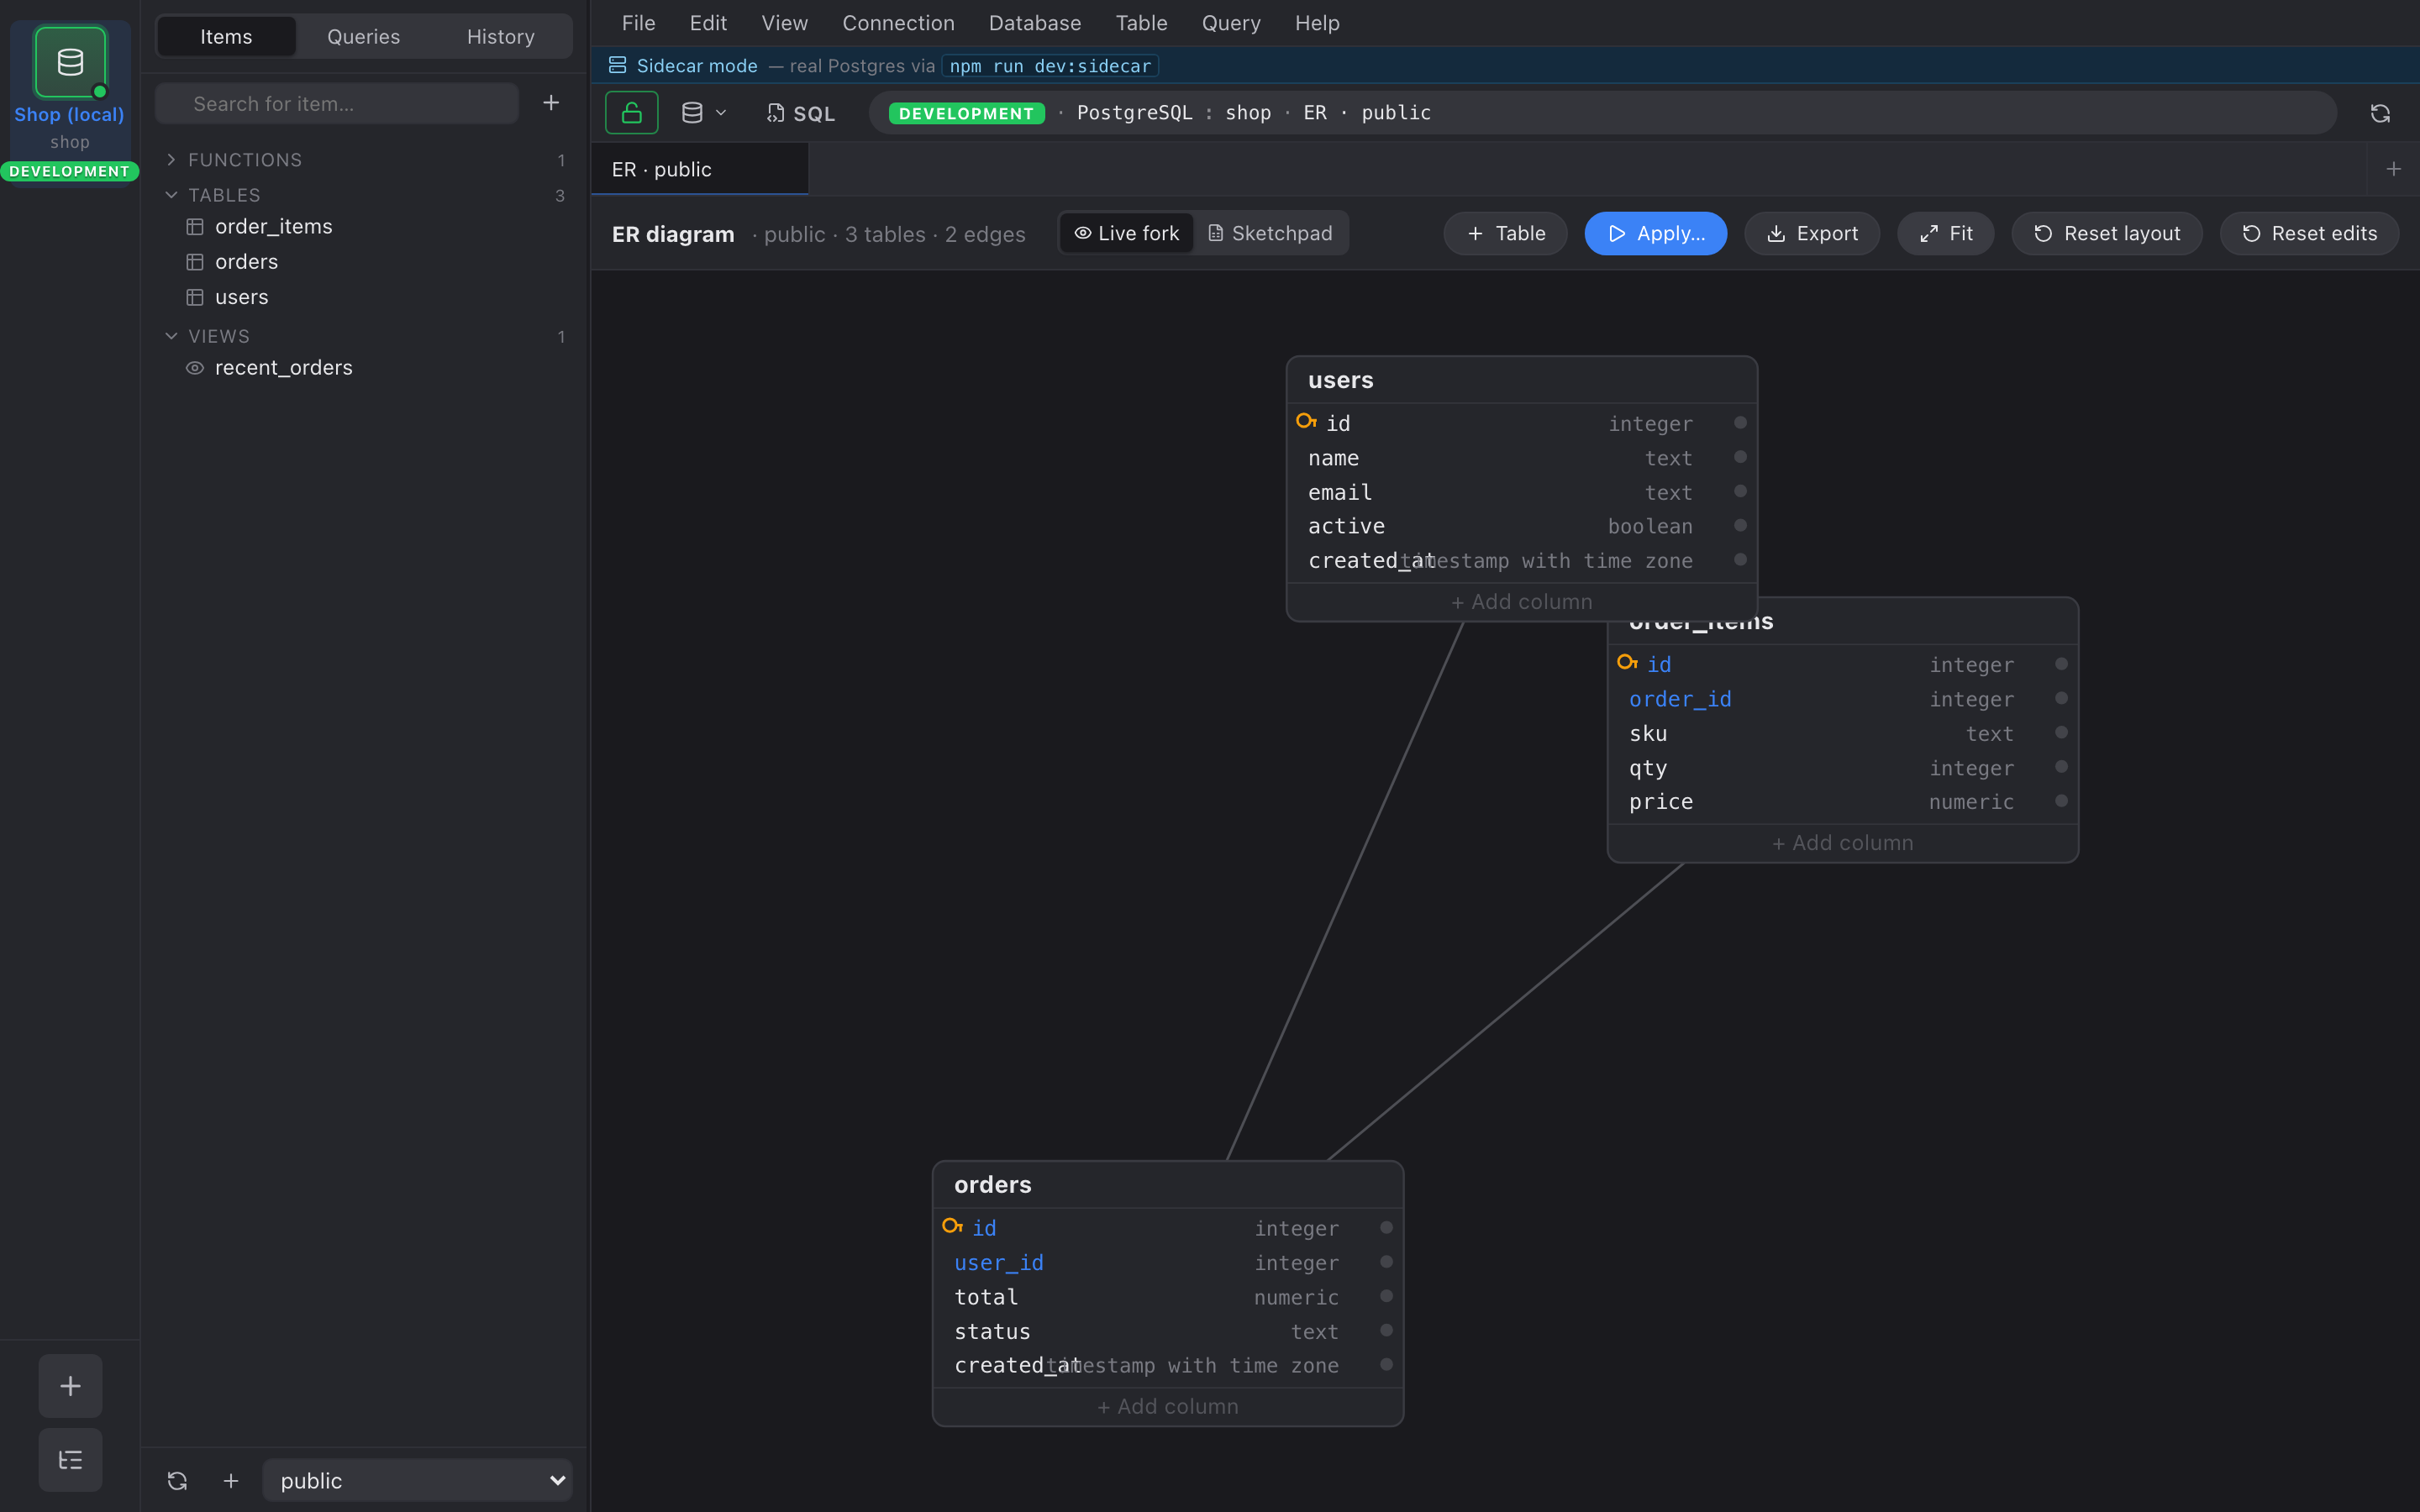
The ER diagram tab renders the current schema as a graph: each table is a node, each foreign key is a directed edge from referencing table to referenced table.
Layout
Section titled “Layout”Nodes are placed with a Fruchterman-Reingold force layout. Edges pull connected tables together and a global repulsive force pushes everything else apart. Nembrix runs the simulation for a fixed iteration count on open, then freezes — no continuous animation eating CPU.
You can drag any node to reposition it. The rest of the graph snaps back into a stable configuration around the change.
Foreign-key arrows
Section titled “Foreign-key arrows”Edges are drawn with an arrowhead at the referenced (parent) end. The label on the edge is the referencing column. Self-referential FKs draw as a loop on the node.
Composite FKs collapse into a single edge — hover it for the full column list.
Zoom and pan
Section titled “Zoom and pan”- Scroll to zoom in and out around the cursor.
- Click + drag empty space to pan.
- Double-click empty space to recenter and fit-to-screen.
A small minimap in the bottom-right corner shows the current viewport against the full graph.
Highlighting neighbors
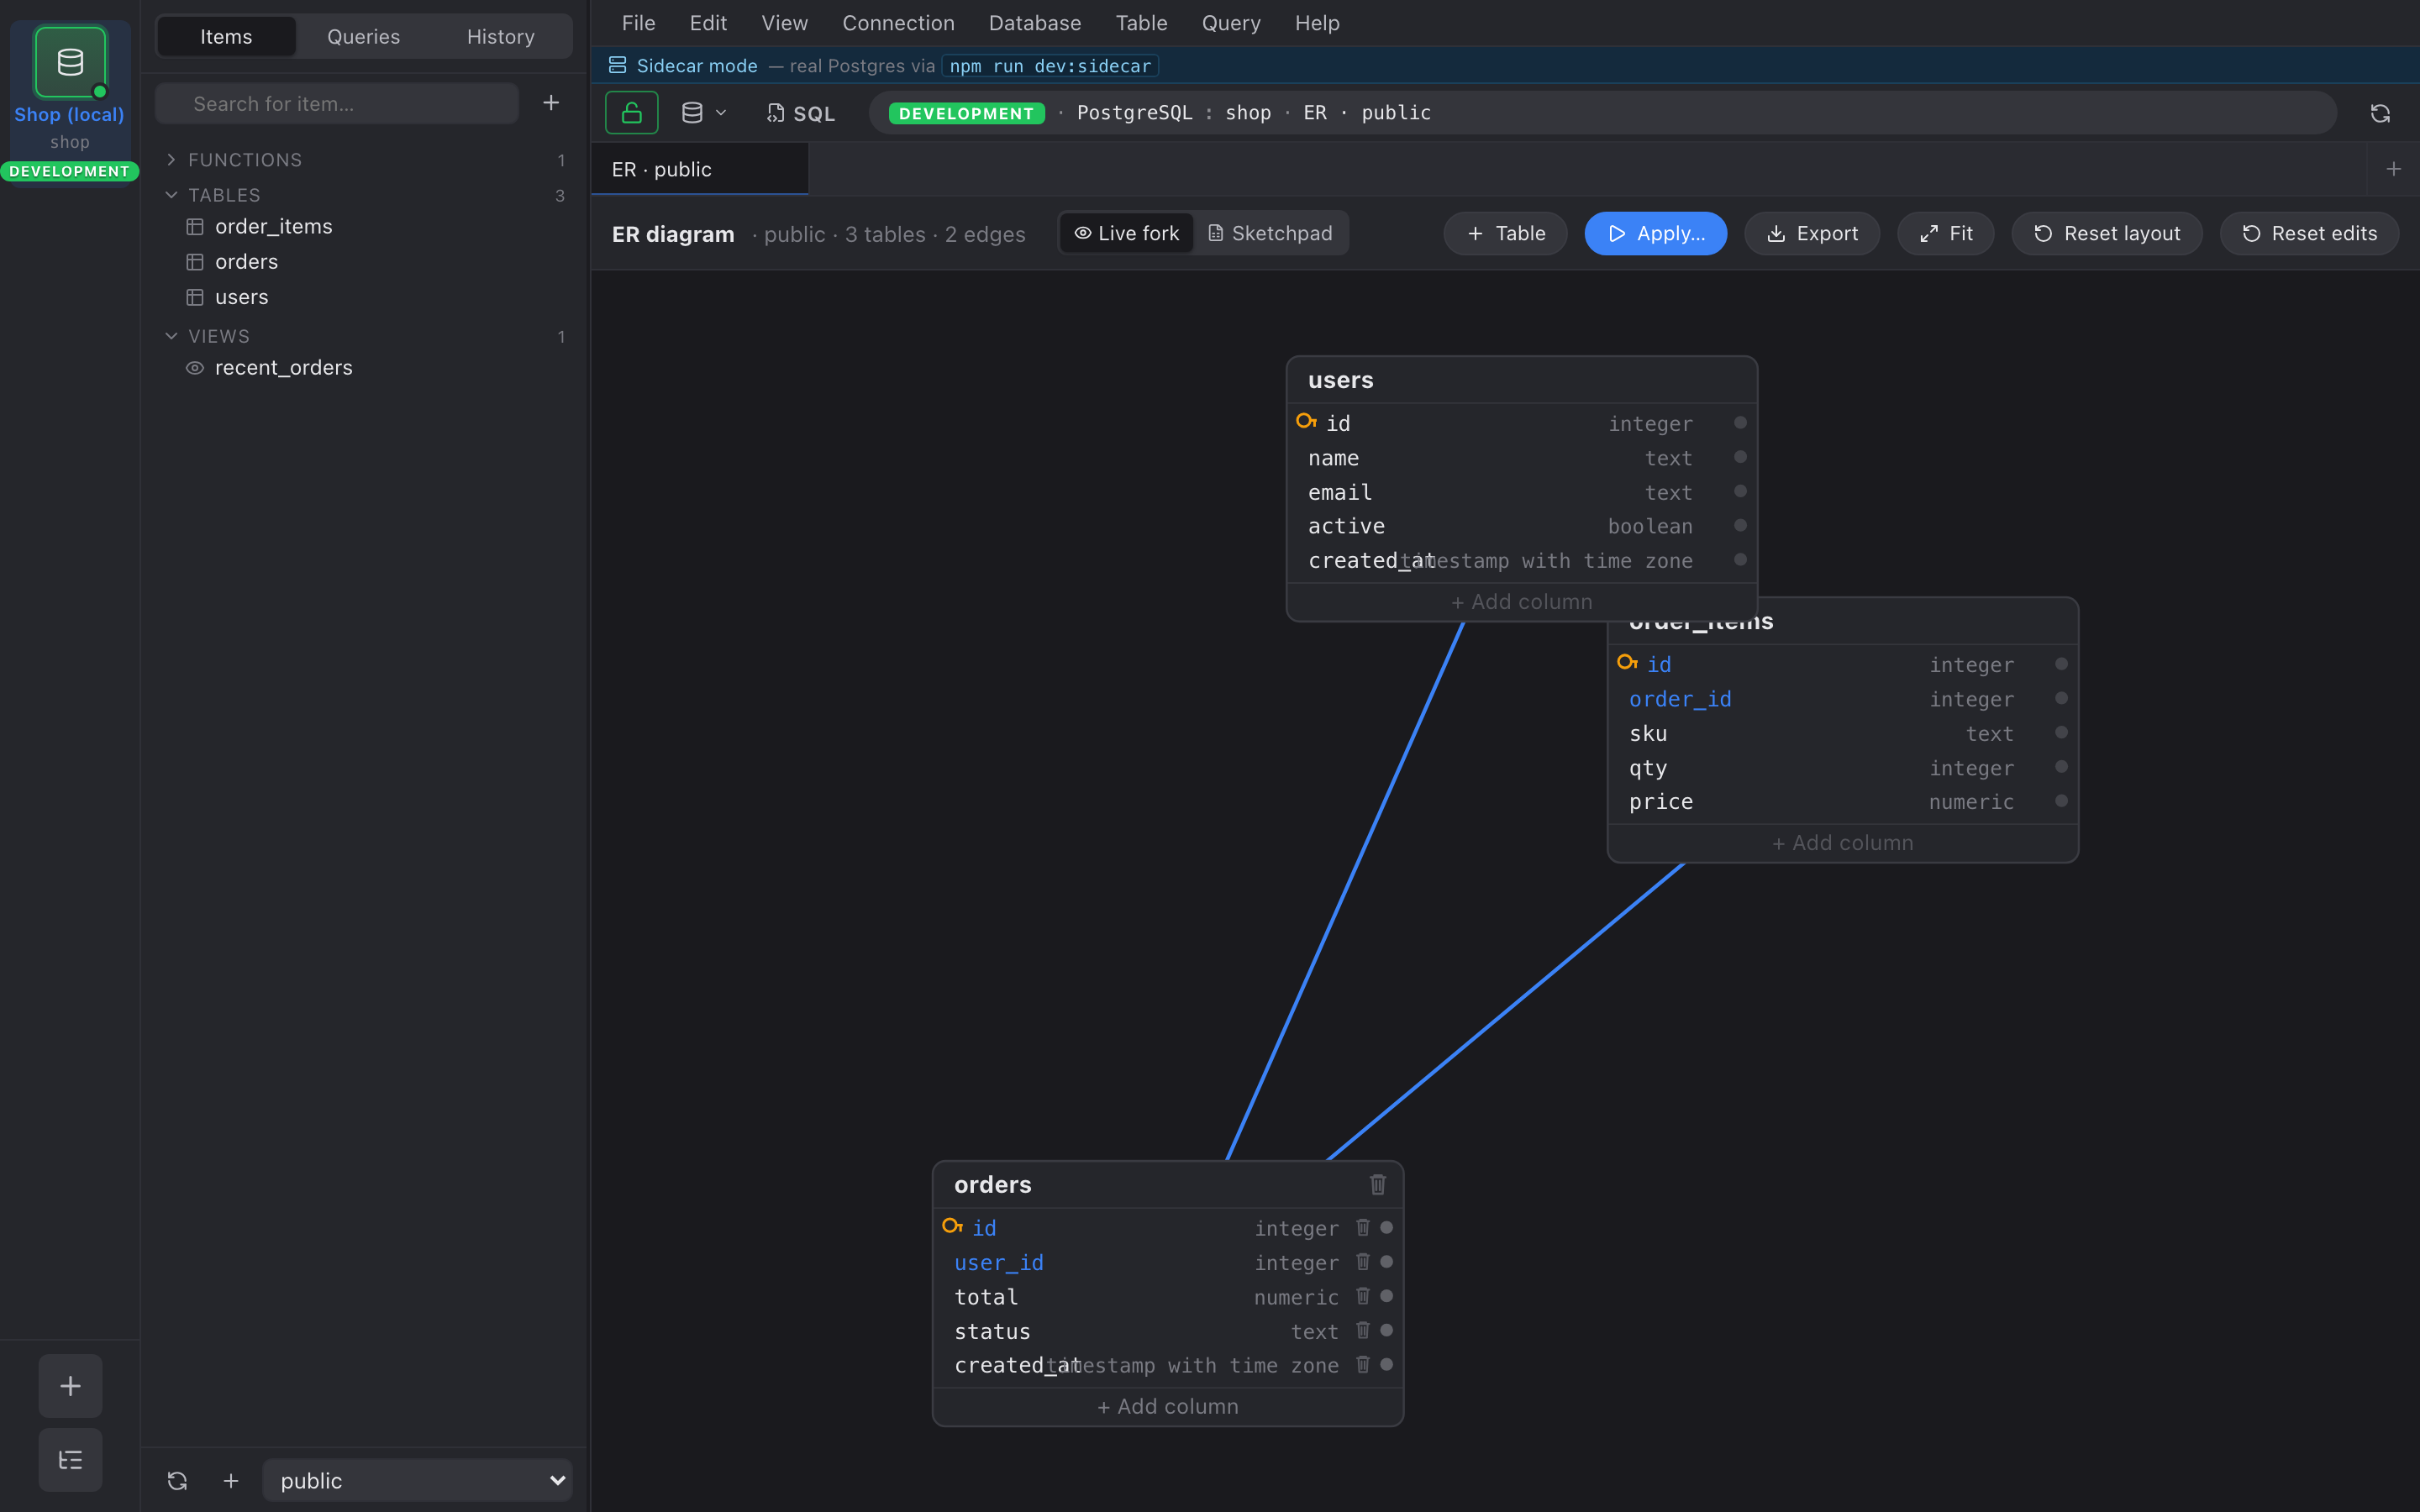
Section titled “Highlighting neighbors”Click a table and Nembrix dims every node except that table and its direct FK neighbors in both directions. Click empty space, or the same table again, to clear the highlight.
Right-click a table for the same menu the inspector uses — Open in tab, Copy qualified name, etc.