
Query analysis
Ce contenu n’est pas encore disponible dans votre langue.
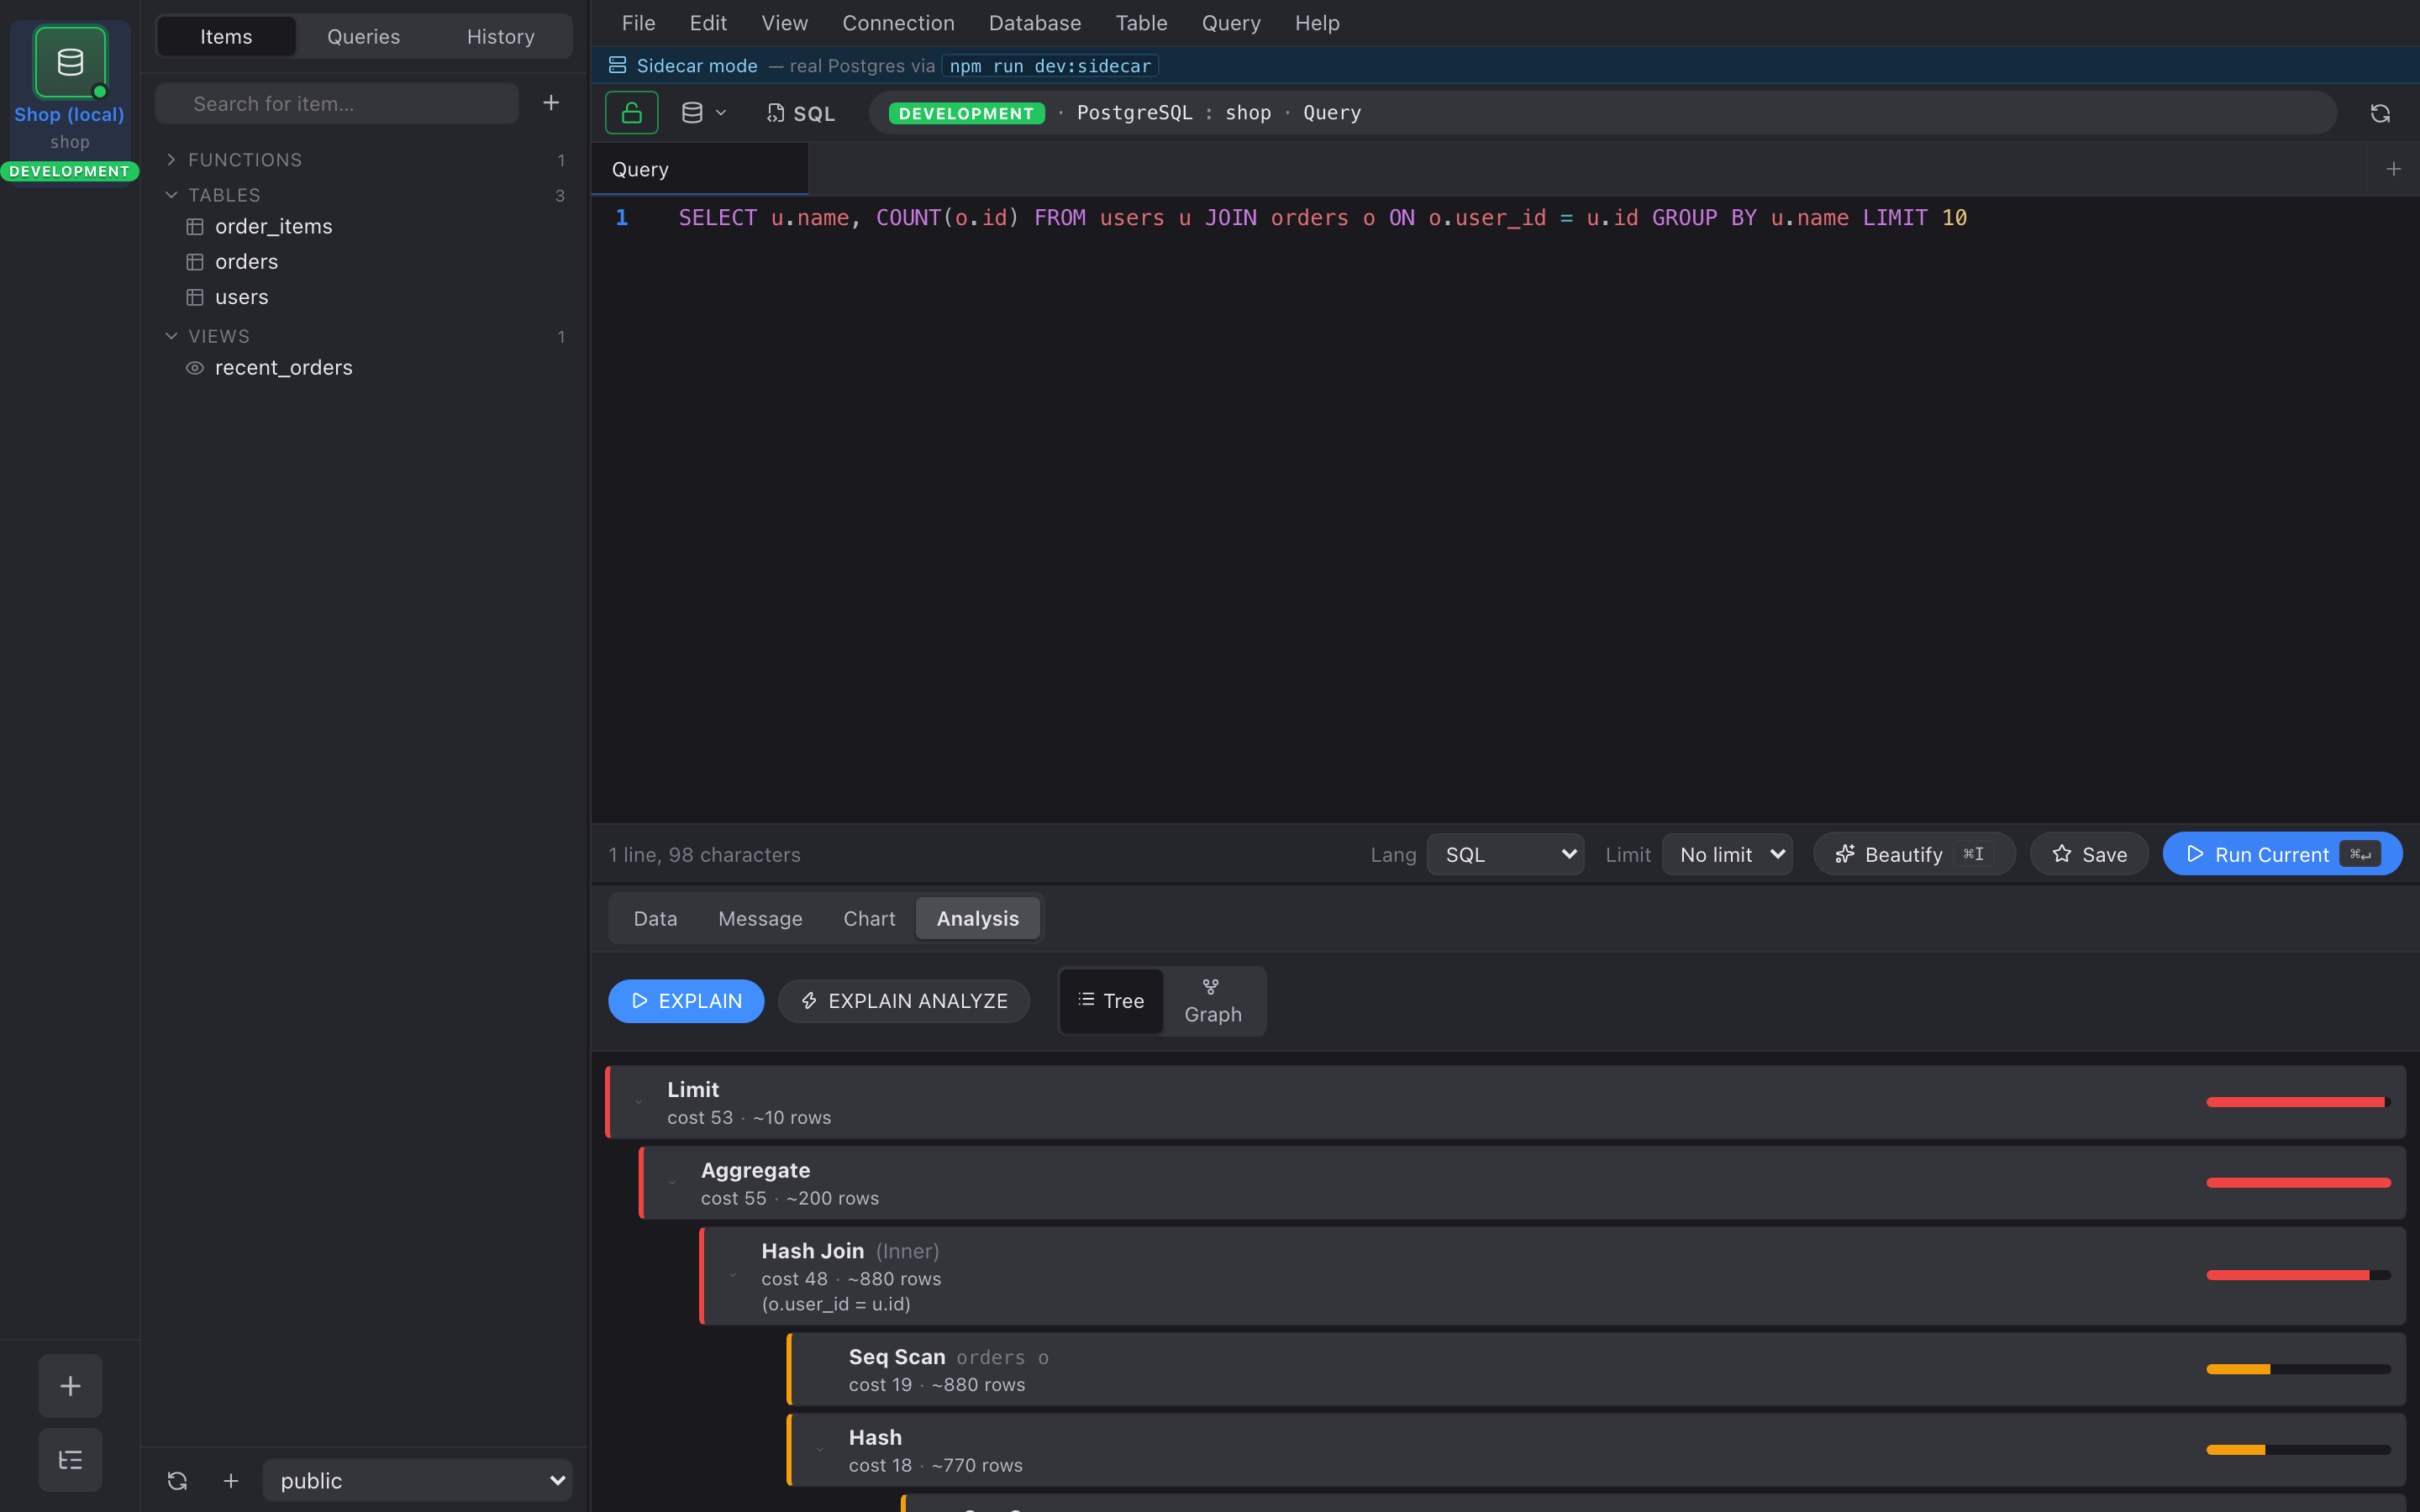
The Analysis tab in any query view runs EXPLAIN (or EXPLAIN ANALYZE) for the current SQL and renders the plan as a hierarchy.
EXPLAIN vs EXPLAIN ANALYZE
Section titled “EXPLAIN vs EXPLAIN ANALYZE”- EXPLAIN — the planner’s cost estimate. No execution, safe on production.
- EXPLAIN ANALYZE — actually runs the query and measures every
node. We wrap it in
(ANALYZE, VERBOSE, BUFFERS, SETTINGS, FORMAT JSON)so you also get buffer / IO counters and the relevant planner GUC values.
Reading the tree
Section titled “Reading the tree”Each node shows:
- Node type — Seq Scan / Index Scan / Hash Join / Sort / …
- Target — table, alias, or index name when applicable.
- Cost or actual time — when ANALYZE is on, you get the real
number; otherwise the planner’s
Total Cost. - Rows — actual row count × loops when ANALYZE is on, planner estimate otherwise.
- Condition —
Index CondorHash Condif present. - Filter + rows-removed-by-filter counter.
The left border of each node is color-coded by its proportional weight: green ≤25%, orange ≤66%, red ≥66%. Click anywhere on the row to expand or collapse its children.
What to look for
Section titled “What to look for”Patterns the heat bar tends to expose:
- A Seq Scan that’s hot but the table has an index on the filter column → add it to the WHERE plan.
- A Nested Loop whose inner Index Scan loops millions of times → rewrite as a Hash Join or push a JOIN condition.
- Big rows-removed-by-filter counts on the outer plan node → pre-filter earlier in the pipeline.