
Server activity
Ce contenu n’est pas encore disponible dans votre langue.
The Activity tab is a server-side observability view, scoped to
the current connection. It polls a handful of pg_stat_* views
on a short interval and renders them in one place.
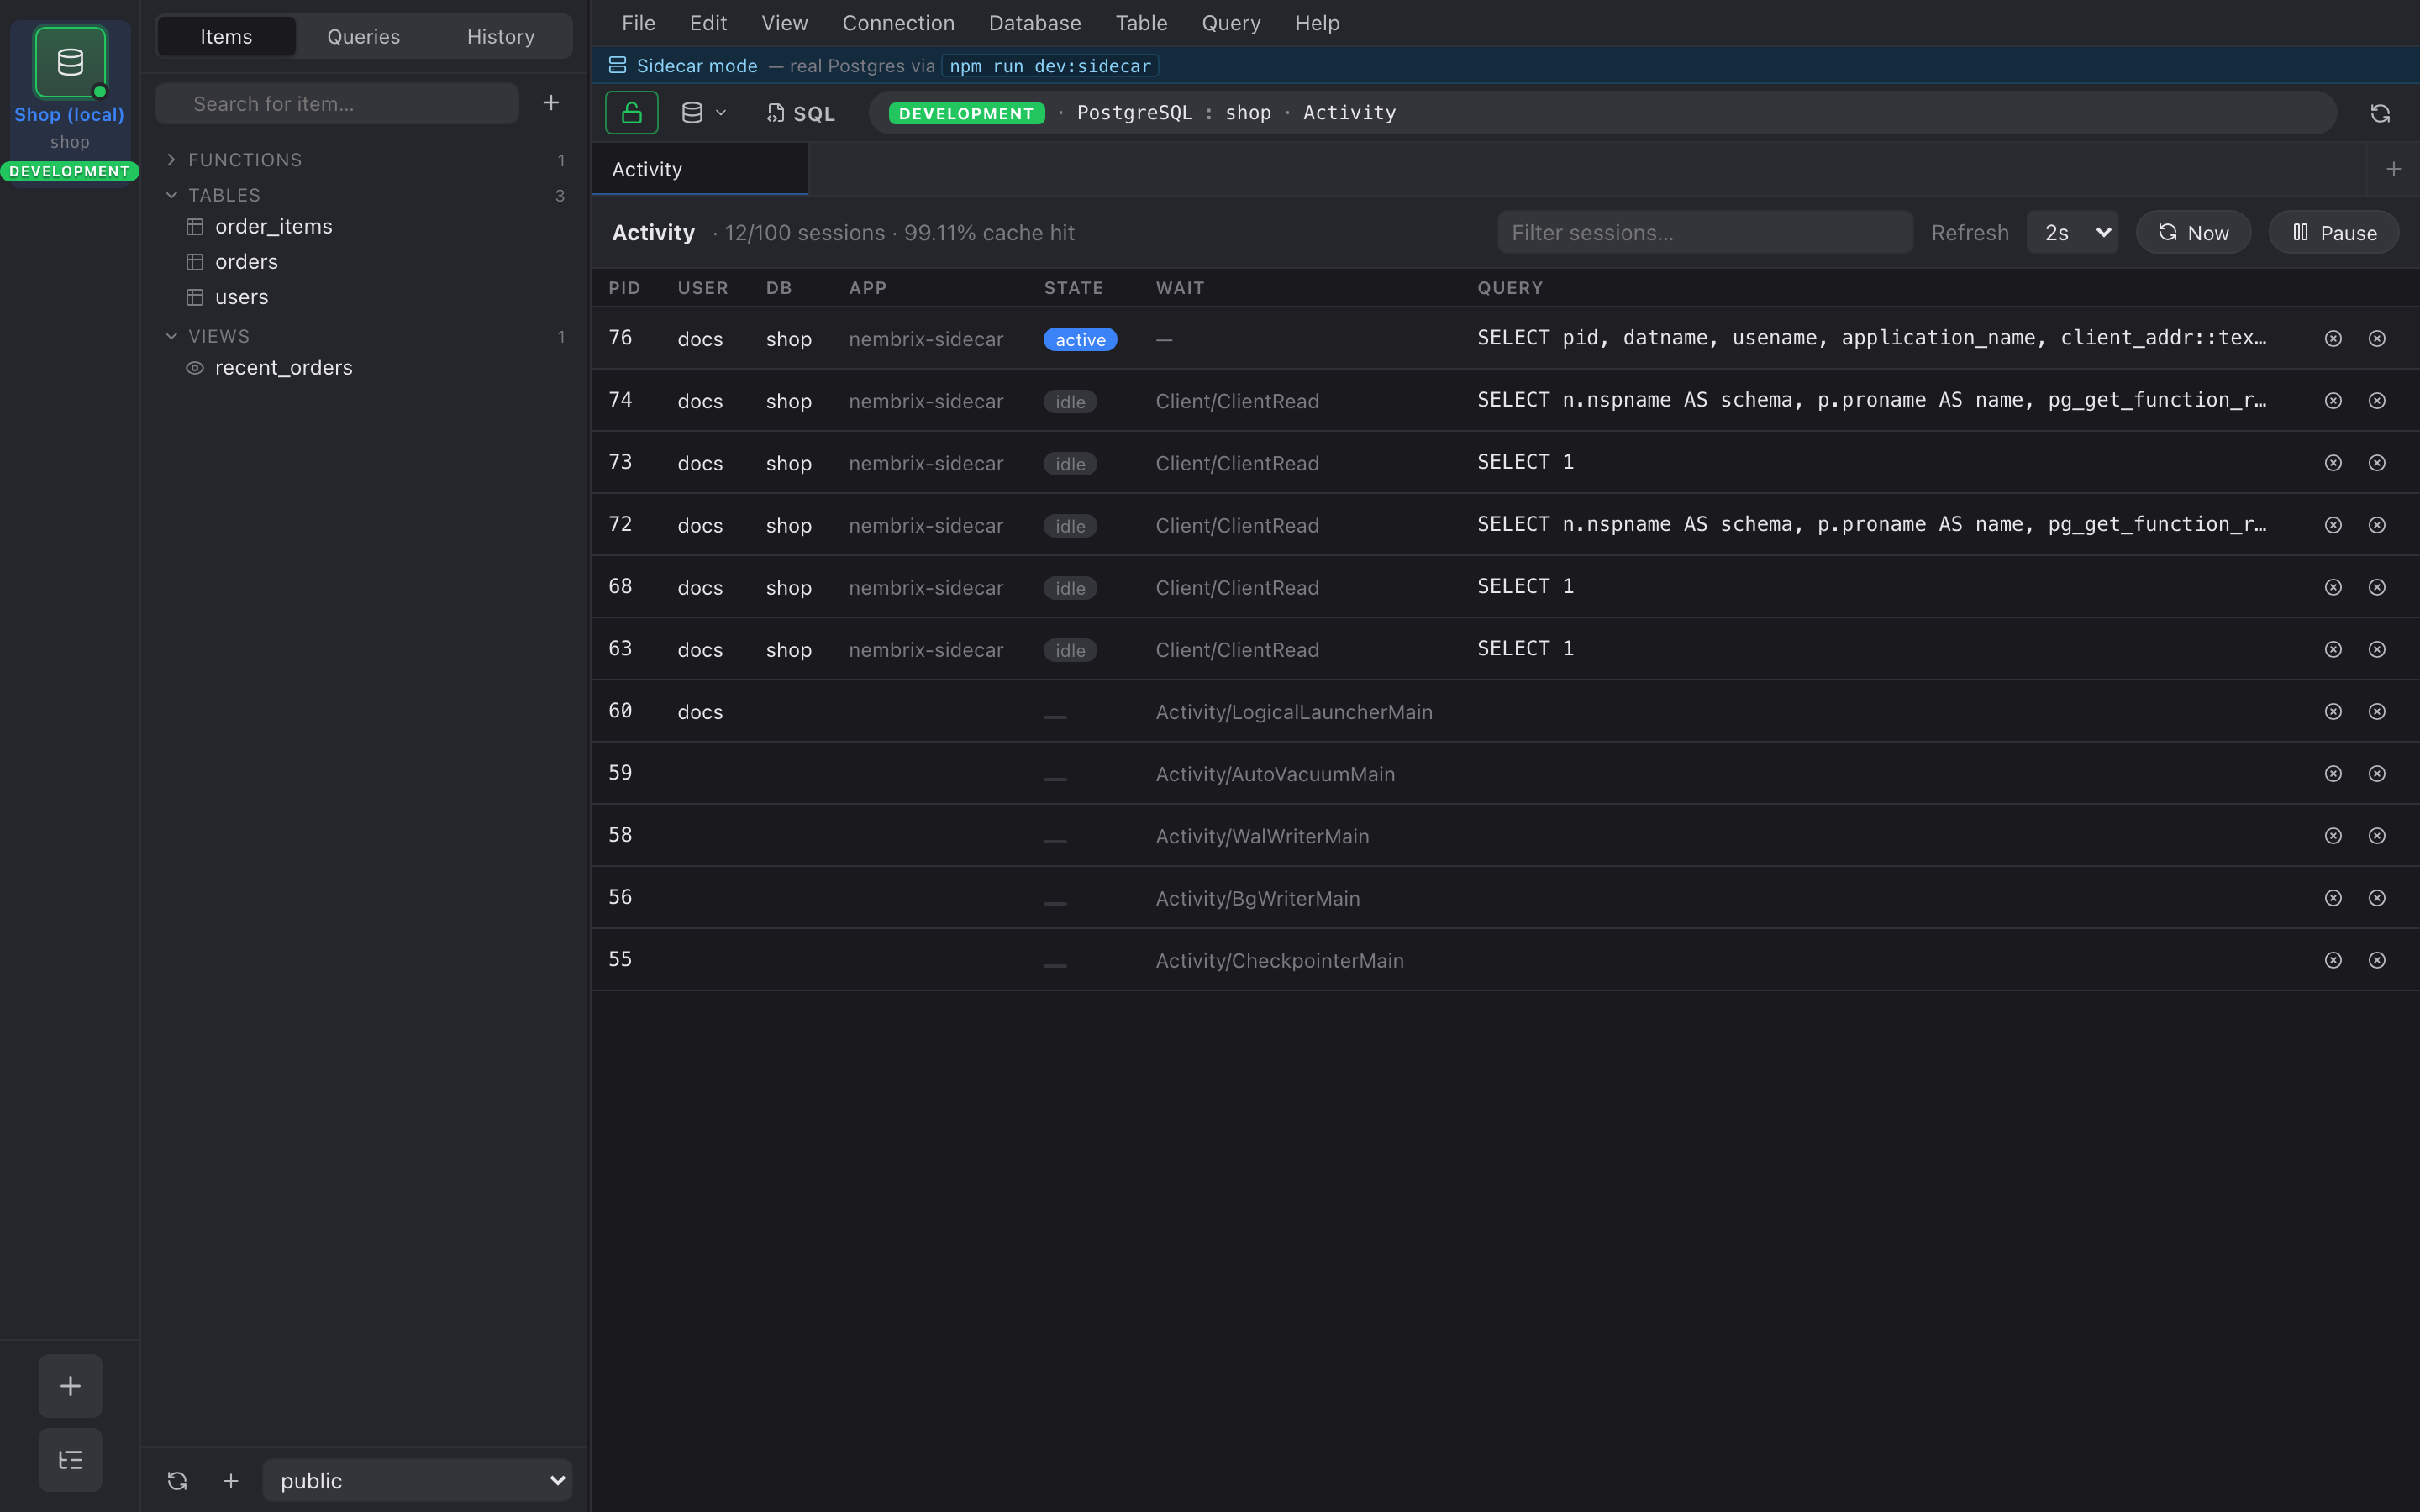
Overview cards
Section titled “Overview cards”The top strip is read-only cards: server version, uptime, total connections (active / idle / idle-in-transaction), cache hit ratio, transactions per second, and current WAL position. Each card highlights yellow / red when it crosses a soft threshold.
pg_stat_activity grid
Section titled “pg_stat_activity grid”Below the overview is a sortable grid of one row per backend, from
pg_stat_activity. Columns: PID, user, database, application,
state, wait event, transaction start, query start, and the
truncated query text.
Right-click a row for two actions:
- Cancel query — runs
pg_cancel_backend(pid). - Terminate connection — runs
pg_terminate_backend(pid).
Both require the appropriate role on the server. Nembrix surfaces the server’s error inline if the call is rejected.
Lock chain visualization
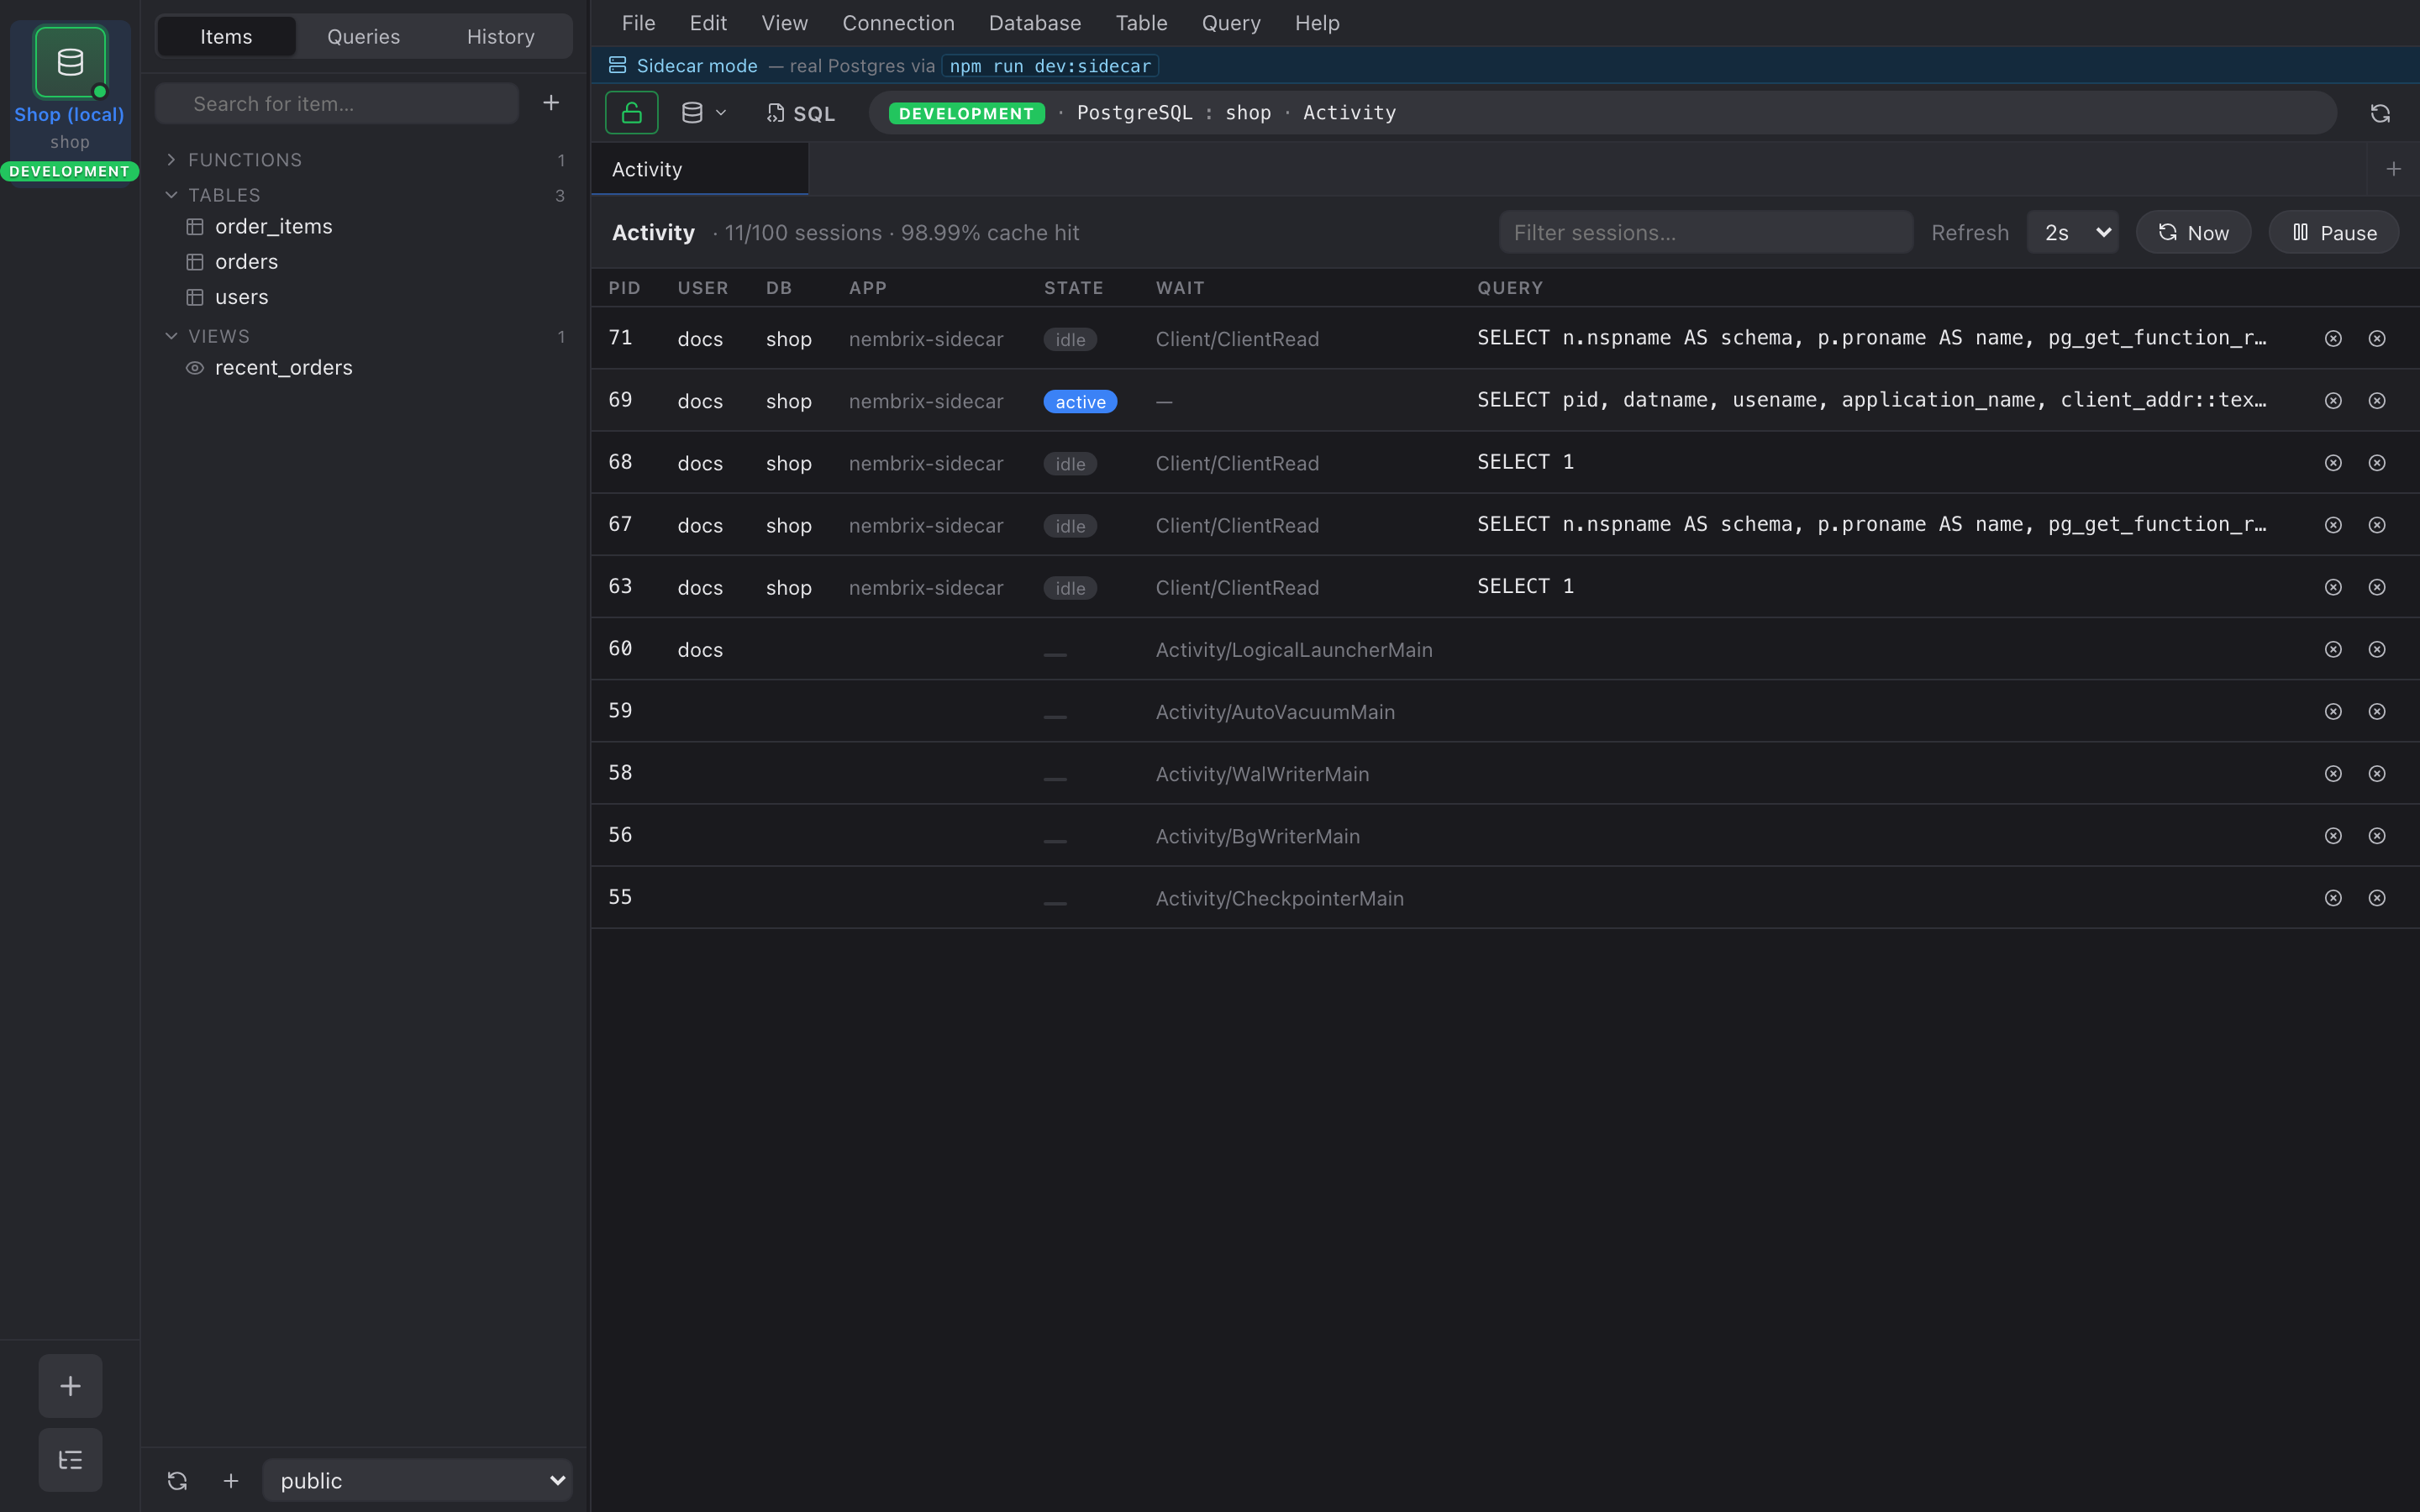
Section titled “Lock chain visualization”A separate panel renders the blocking chain as a graph:
Nembrix walks pg_blocking_pids() for every active backend and
draws an edge from blocker to blocked. Cycles get highlighted in
red — a deadlock the server hasn’t broken yet.
Per-table stats
Section titled “Per-table stats”A third panel reads pg_stat_user_tables and lists each table
with its live tuple count, dead tuple count, last vacuum, last
analyze, sequential scans, and index scans. Sortable and
filterable.
pg_stat_statements
Section titled “pg_stat_statements”If the pg_stat_statements extension is installed and you have
access, a fourth panel surfaces the top queries by total time,
mean time, and call count. If the extension isn’t there, the
panel collapses to a one-line “not available” notice instead.